
Create Artist Map of Downstreet Dar es Salaam with R and Open Street Data
OpenStreetMap (OSM) is a collaborative project to create a free editable geographic database of the world. The geodata underlying the maps is considered the primary output of the project (Wikipedia contributors 2021). OpenStreetMap was born in 2004 in the UK, at a time when map data sources were controlled by private and governmental players. They were expensive and highly restrictive which made them accessible only by large companies.
The idea behind OSM was to solve this problem by using a Wikipedia-like model and create a free, editable map of the world made entirely by the voluntary efforts of online masses. Mark Padgham and colleagues (2017) developed osmdata, which is an R package for downloading and using data from OpenStreetMap (OSM). osmdata allows people to access and download vector data available in the OSM database all over the world.
In this post, we are going to learn how to download the street features lines and highway in the busiest commercial city of Dar es Salaam, Tanzania and make ana artist map. Before we run into the session, let’s first load the packages we need in our assignment.
library(tidyverse)
library(osmdata)
library(sf)
library(showtext)
Then we download the highway. For this case we are going to dowload only the four types of highyway that are avaialble. These include motorway, primary, secondary and tertiary roads in the city as simple features.
streets <- getbb("dar es salaam Tanzania")%>%
  opq()%>%
  add_osm_feature(key = "highway",
                  value = c("motorway", "primary",
                            "secondary", "tertiary")) %>%
  osmdata_sf()
Then download the street lines of the city, like the highway, we specify the streelines we want to download and for this case, residential, living_street, service and footway are needed. Any street that is unclassified we don not need for the time being and hence we exclude from the list.
small_streets <- getbb("dar es salaam Tanzania")%>%
  opq()%>%
  add_osm_feature(key = "highway",
                  value = c("residential", "living_street",
                            #"unclassified",
                            "service", "footway")) %>%
  osmdata_sf()
Once we have downloaded the data, we must design the layout of the map in advance, this comes down to choosing the color we would use for our maps. The chunk below show the codes that specify colors that we will use for our map.
background_color<-'#1E212B'
street_color<-'#FAD399'
small_street_color<-'#D4B483'
font_color<-'#FFFFFF'
Then we download and add a font we want to use
font_add_google("Quattrocento", "Quattrocento")Once everything in place, we then map the downtown street of the commercial city of Dar es Salaam using a ggplot2 package (Wickham 2016). The chunk below highlight the code used to make a map shown in figure 1.
blr_dark<-ggplot() +
  geom_sf(data = streets$osm_lines,
          inherit.aes = FALSE,
          color = street_color,
          size = .5,
          alpha = .6) +

  geom_sf(data = small_streets$osm_lines,
          inherit.aes = FALSE,
          color = street_color,
          size = .3,
          alpha = .6) +

  theme_void() +
  theme(plot.title = element_text(family = 'Quattrocento',
                                  color=font_color,
                                  size = 18, face="bold", hjust=.5,
                                  vjust=2.5),
        panel.border = element_rect(colour = "white", fill=NA, size=3),
        plot.margin=unit(c(0.6,1.6,1,1.6),"cm"),
        plot.subtitle = element_text(color=font_color,
                                     family = 'Quattrocento',
                                     vjust=0.1,
                                     size = 12, hjust=.5, margin=margin(2, 0, 5, 0)),
        plot.background = element_rect(fill = "#282828")) +
  coord_sf(xlim = c(39.26, 39.3),
           ylim = c(-6.83, -6.8)) +

  labs(title = "Downtown, Dar es Salaam",
       subtitle = '6.8301° S, 39.30812° E')

blr_dark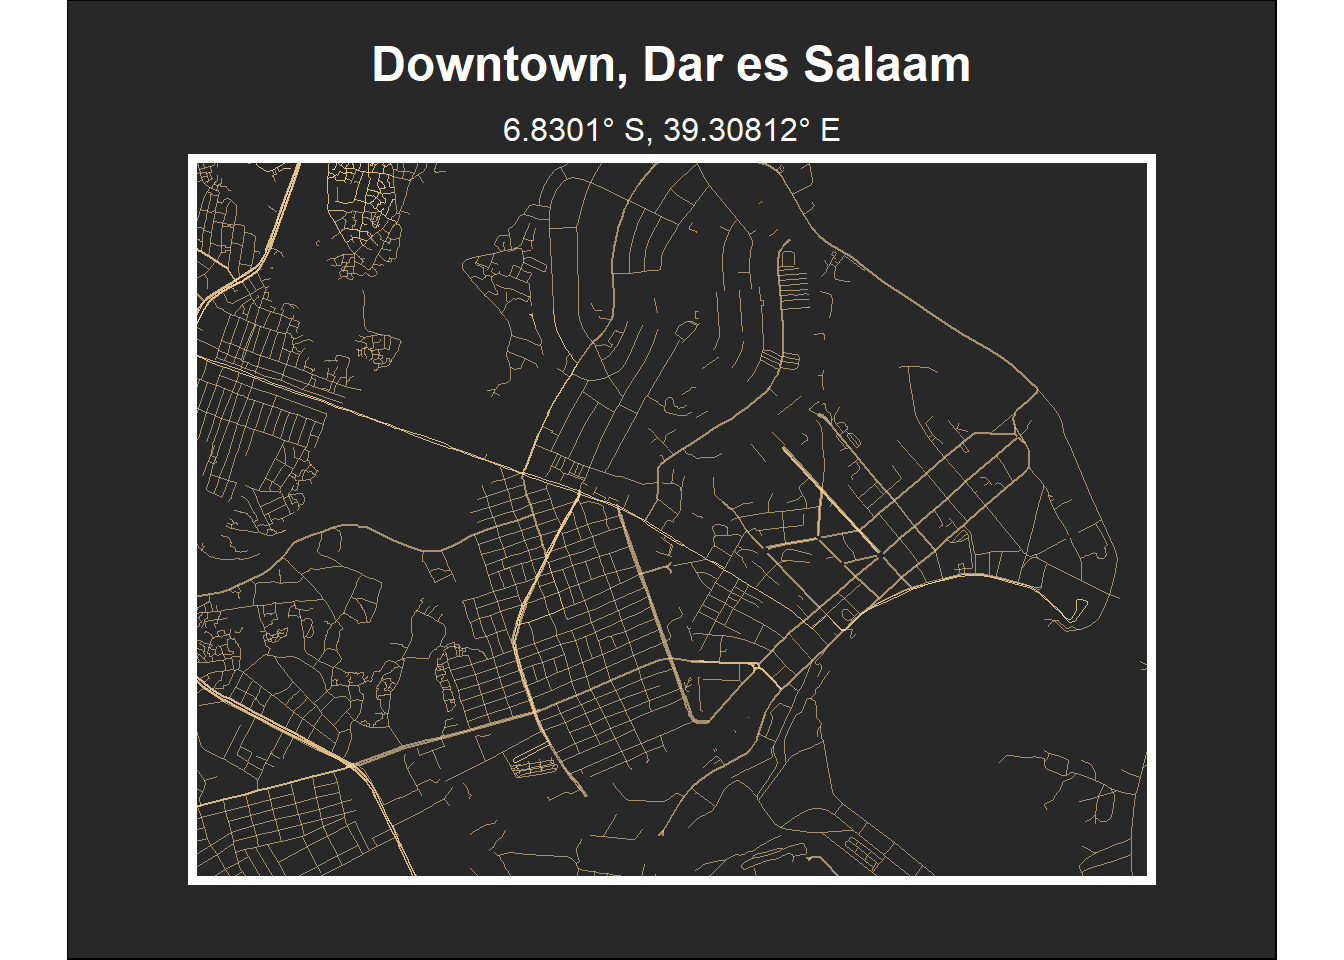
Figure 1: Artist Map of the downtown street of Dar es Salaam
